Data analysis for materials and chemistry.

Nonlinear regression, peak fitting, hypothesis testing and phase identification for XRD, spectroscopy, kinetics and mechanical data. Every fit reports parameter uncertainties, and every result is checked against the reference Python libraries before release.

Free to use · Runs in your browser · Your data stays on your computer

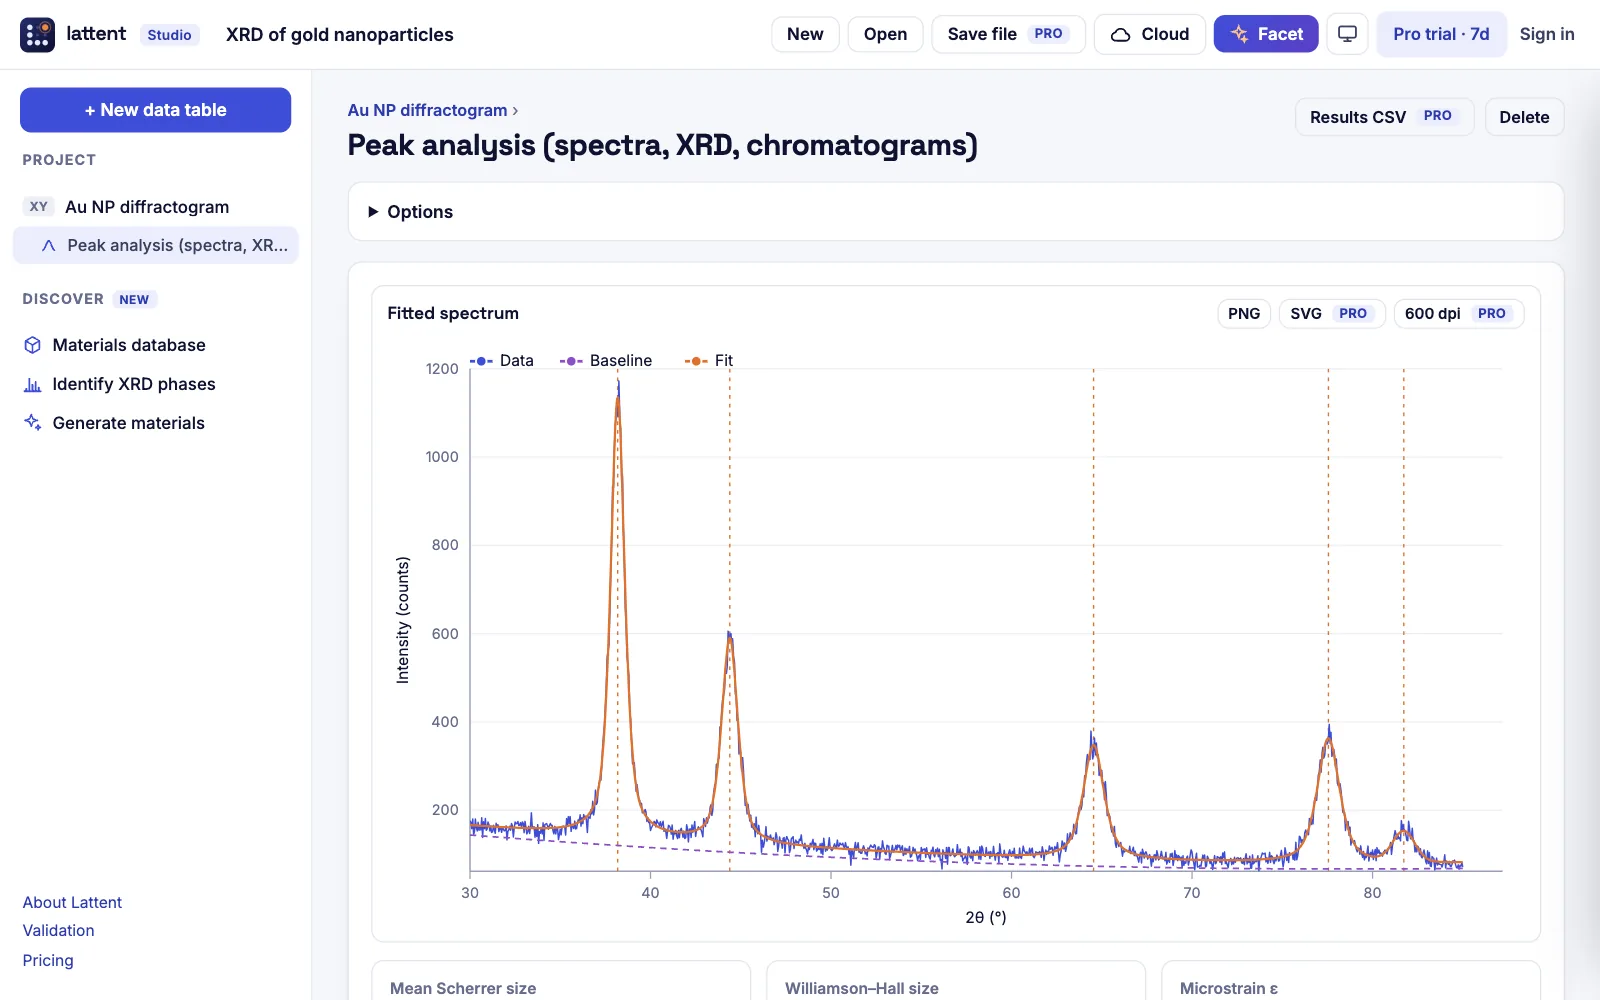
Lattent Studio fitting the X-ray diffraction pattern of gold nanoparticles, with Scherrer crystallite size and microstrain

Built for

What Lattent addresses

The problem

Analysis is slow and scattered.

Data in one program, fits in another, figures in a third, and a script nobody else in the group can run.

With Lattent

One workspace in your browser: paste the data, get the fit, statistics, publication figure and methods text in minutes.

See what it analyses →
The problem

Errors slip into papers.

A fit with too few points, an ANOVA on skewed data, a crystallite size beyond what the method can measure.

With Lattent

An engine checked against SciPy, and Facet, an AI lab partner that reviews every analysis for these mistakes before you publish.

How the numbers are checked →
The problem

What to make next is guesswork.

Which phase is in this pattern? Which composition, recipe or temperature should the next run use?

With Lattent

Phase identification against 5.8 million computed crystals, Bayesian optimisation and generative design point to the next experiment.

See discovery and AI →
  1. Paste your measurementsXRD, UV–Vis, Raman, isotherms, kinetics, tensile tests or any table, straight from Excel or the instrument.
  2. Lattent analyses and checksIt recognises the data, fits the right model or test, and flags anything doubtful.
  3. Publish, then go furtherExport the figure and methods text, identify phases, and get the next experiments to run.

Your data never leaves your computer.

Lattent computes every fit, test, model and figure in your browser. Unpublished measurements, formulations and process data are not uploaded to be analysed, which is why R&D groups that cannot send data to cloud tools can use it.

Computed locally

The analysis engine and all sixteen models are JavaScript running on your machine. Heavy jobs run in a background thread of the same browser tab.

Verify it yourself

Open your browser’s network panel while you work. Apart from loading the page, no request carries your data unless you choose one of the options below.

Cloud only when you ask

Projects reach our database only when you press Save to cloud. Row-level security limits access to you and your lab, and you can delete everything at any time.

AI only with your key

Facet’s suggestions, checks, graph reading and reports run locally. The optional chat goes directly from your browser to the provider you choose, under your own account.

Database searches in Discover send only element names or formulas. For an internal installation behind your firewall, talk to us. Details: privacy notice · security.

Why not just ask ChatGPT or Claude?

Language models are superb at explaining and planning. They are not a dependable way to produce the numbers in your paper.

A chatbot on its own

  • Writes fresh code each time, so the same data can give different answers
  • Can state a fitted value it never actually computed
  • Leaves no record linking each number to your data and settings
  • Figures change style with every prompt
  • Your unpublished data is sent to a third party

With Lattent

  • One engine, checked against SciPy on every release, gives the same answer every time
  • Facet, the AI lab partner, proposes analyses; Lattent computes them and shows its working
  • Data, analysis options, results and graphs stay linked: edit a value and everything updates
  • Consistent, colour-blind-safe, journal-ready figures and methods text
  • Calculations run locally; the AI is optional and uses your own key

Generative AI for materials discovery, in your browser.

Microsoft’s MatterGen and Google DeepMind’s GNoME showed a new way to find materials: generate candidates, screen them with machine-learned property models, and check them against computed data. Lattent brings that loop to your bench at the level of chemical composition, next to the 5.8 million DFT structures of the open Alexandria database.

01

Search 5.8 million computed crystals

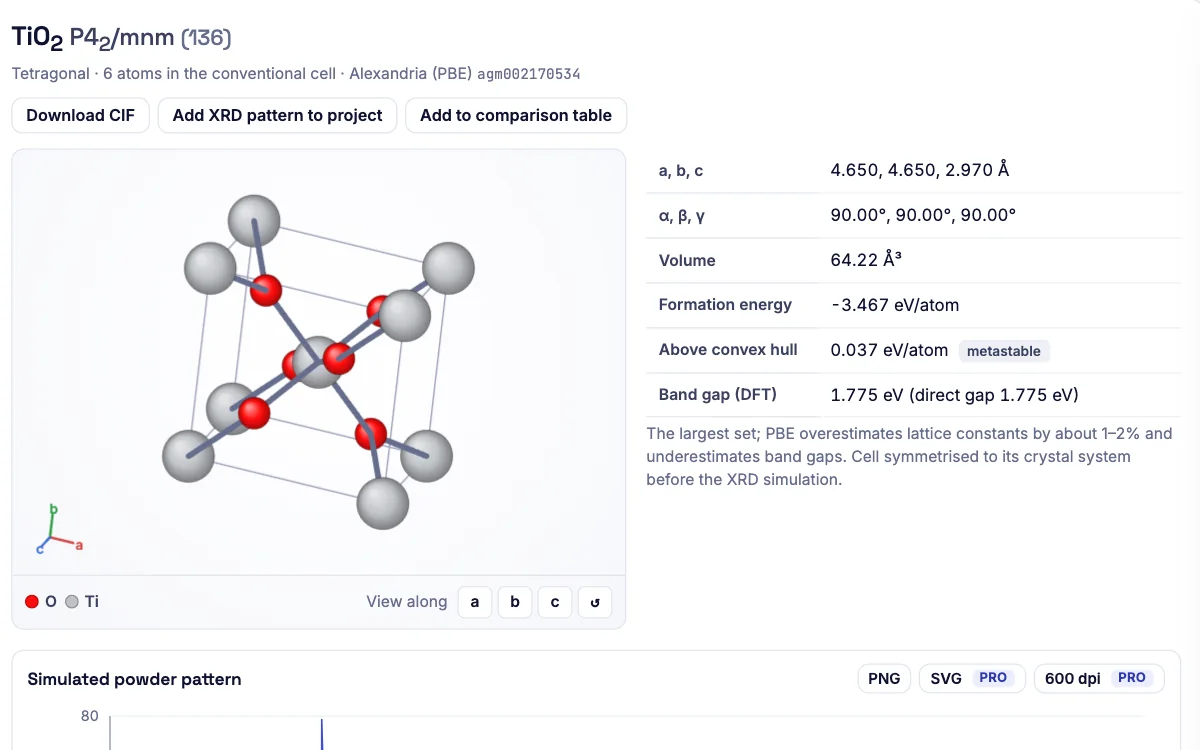
Each material comes with its structure in 3D and conventional cell, formation energy, distance to the convex hull, band gap, a simulated powder pattern with Miller indices, and a CIF file.

Rutile TiO2 from the Alexandria database in Lattent's 3D structure viewer, with lattice parameters, formation energy and band gap
02

Identify the phases in your XRD

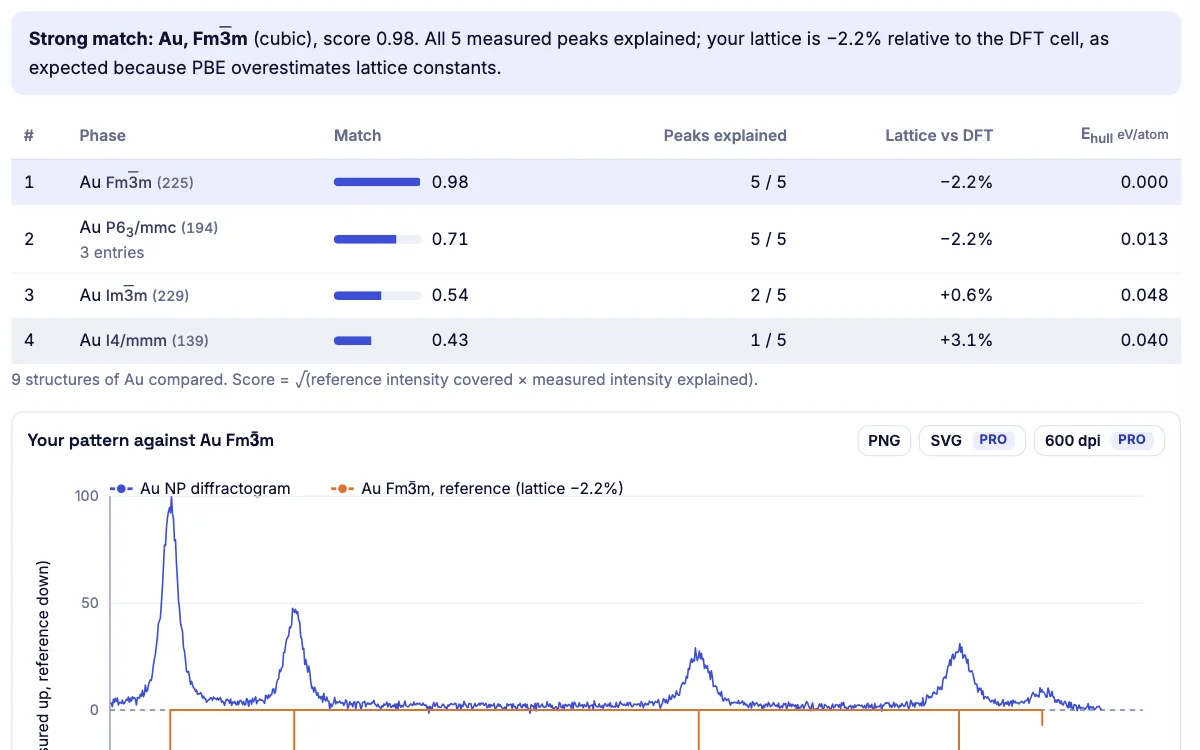
From a peak fit to a ranked list of phases in seconds. Every candidate cell is symmetrised, simulated and matched with a refined lattice scale; peaks left unexplained point to a second phase.

Gold nanoparticle XRD identified as fcc Au, Fm-3m, with a match score of 0.98 and every peak indexed
03

Generate new compositions

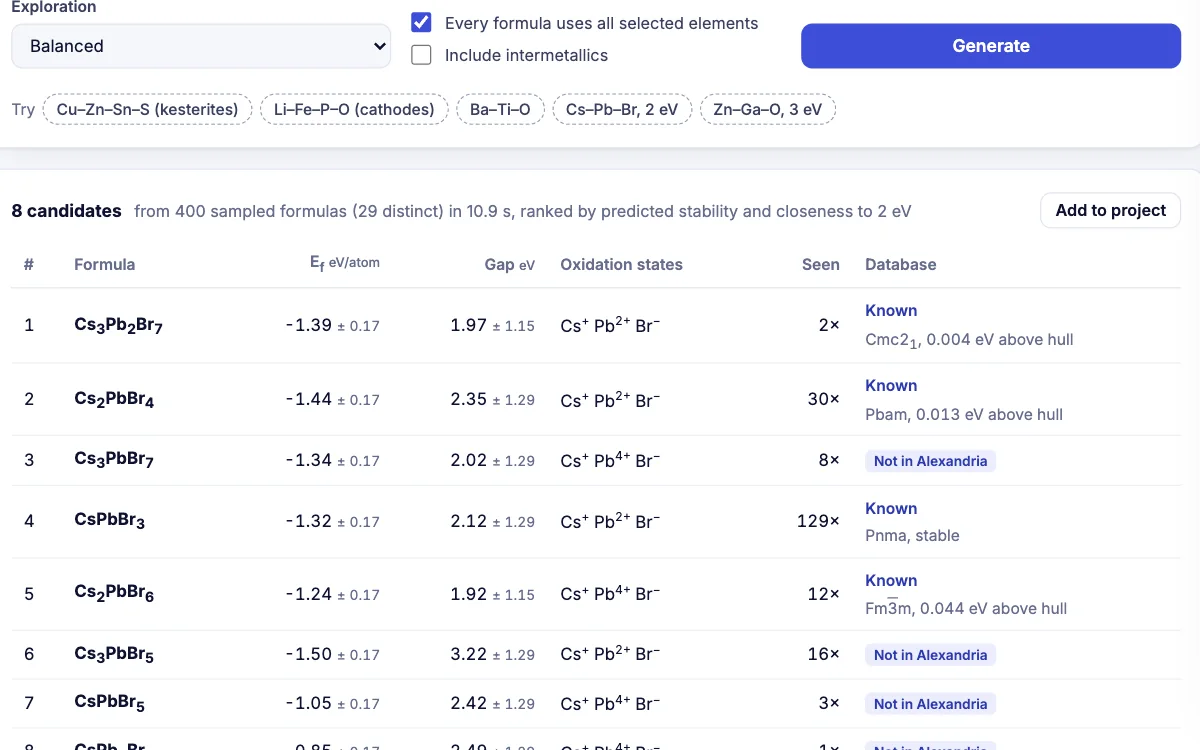
Lattent’s own masked-diffusion model, trained on the Materials Project, proposes formulas in your chemical system, steered towards a band gap. Property networks predict formation energy (MAE 0.09 eV/atom) and band gap, and the database shows which candidates are new.

Generated Cs–Pb–Br compositions with predicted formation energies, band gaps, oxidation states and novelty against Alexandria

Honest limits: Lattent generates compositions, not full crystal structures, and its predictions are leads for a DFT calculation or a synthesis, not results. Lattent is not affiliated with Microsoft, Google DeepMind, the Materials Project or the Alexandria project.

Sixteen models, one bench.

Beyond generative design, Lattent recognises your data, discovers equations, trains AutoML models with calibrated uncertainty and optimises your next experiment. Each element is a model, with its result on data it never saw.

Explore the AI and try it live →

Spectra, diffraction and mechanical tests

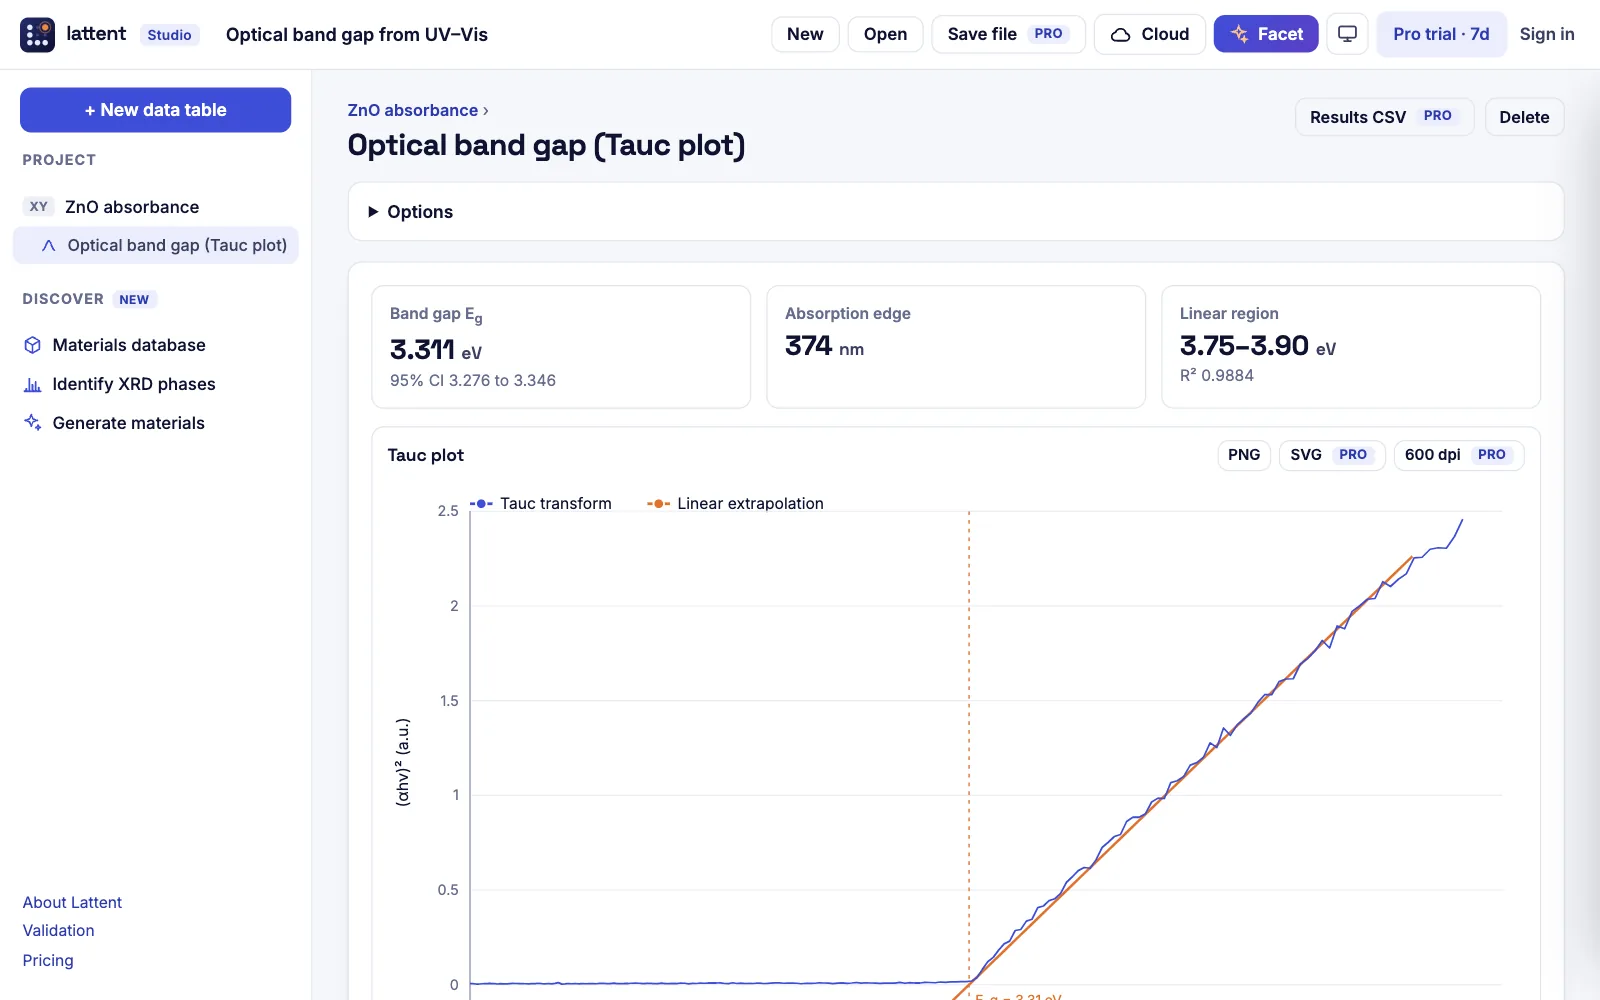
Lattent understands the measurements materials labs run every day. Fit overlapping XRD, Raman or XPS peaks on a fitted baseline; get d-spacings, Scherrer crystallite size and Williamson–Hall strain; extract optical band gaps from UV–Vis; and read modulus, yield, strength and toughness from stress–strain curves.

  • Gaussian, Lorentzian and pseudo-Voigt multi-peak fitting
  • Tauc analysis for direct and indirect transitions
  • Area under the curve, Savitzky–Golay smoothing and derivatives
Tauc plot giving the optical band gap of ZnO nanocrystals

Fit any model, then let the data choose

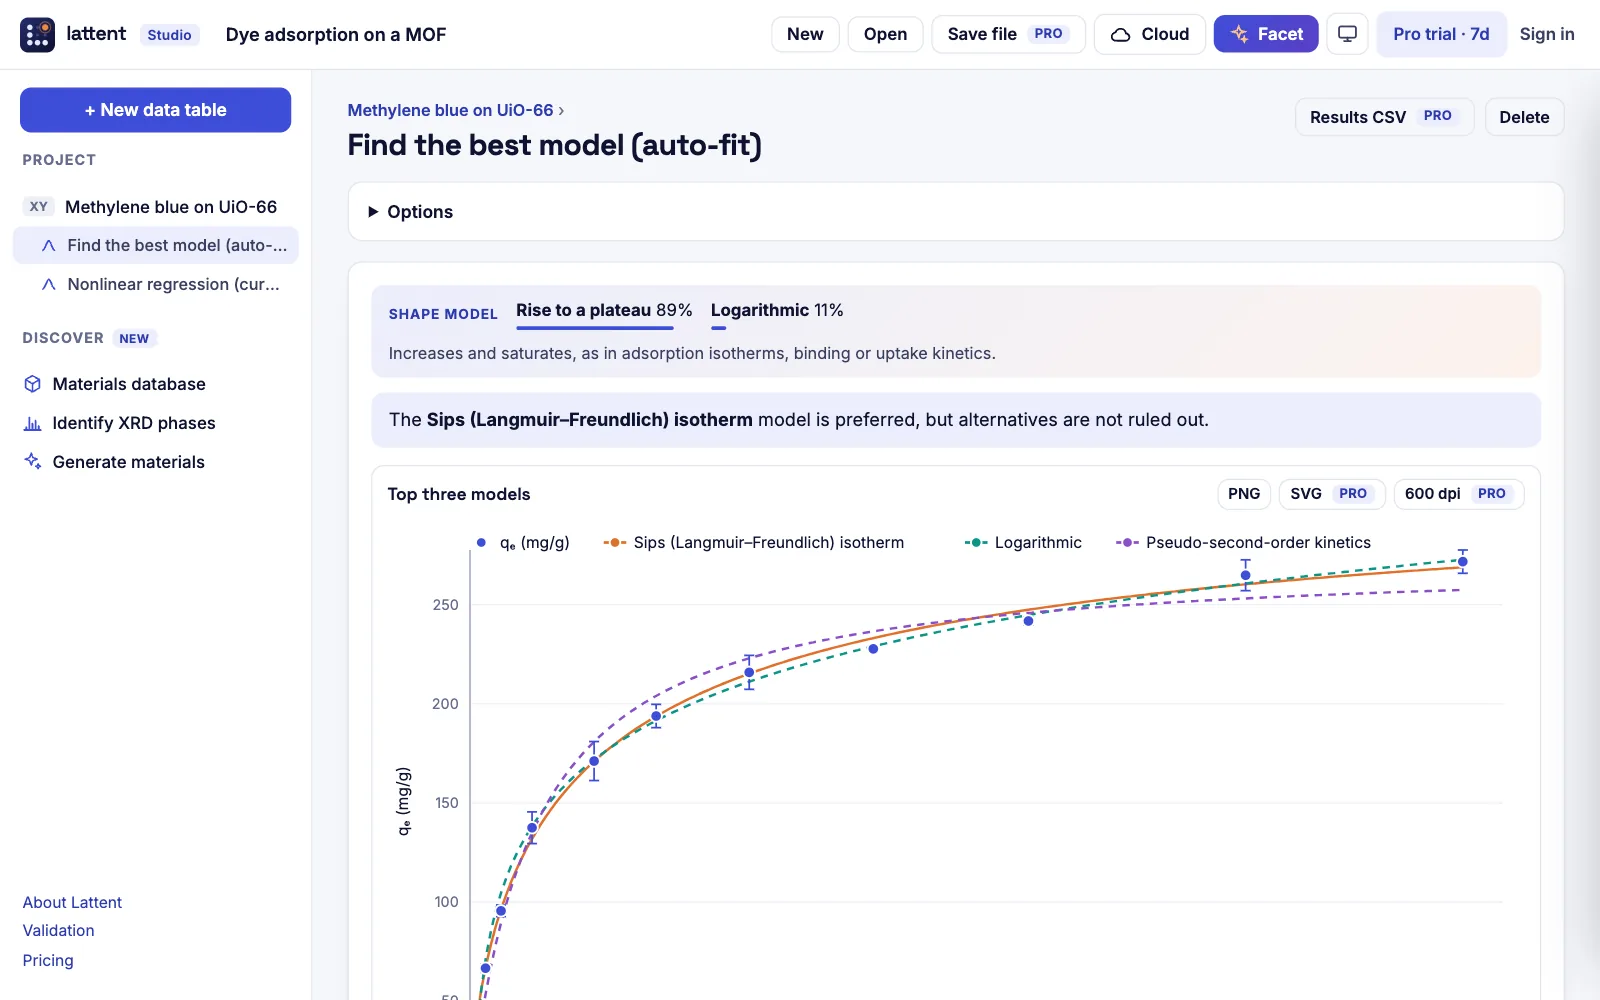
Thirty-five equations from materials science, polymers, nanomaterials and chemistry (Arrhenius, Langmuir and Sips, Avrami, Carreau, WLF, Hall–Petch, Tafel and more), or type your own. Lattent's shape model recognises what kind of behaviour your data show and narrows the equations to the plausible ones. Auto-fit then ranks them by AICc, so you see what the data support.

  • Confidence intervals and confidence bands, derived quantities such as Eₐ in kJ/mol and eV
  • Constraints, weighting, residual plots and runs test
  • Plain-language warnings when a parameter is poorly determined
Shape-guided auto-fit ranking adsorption isotherm models by AICc

From your data to the next experiment

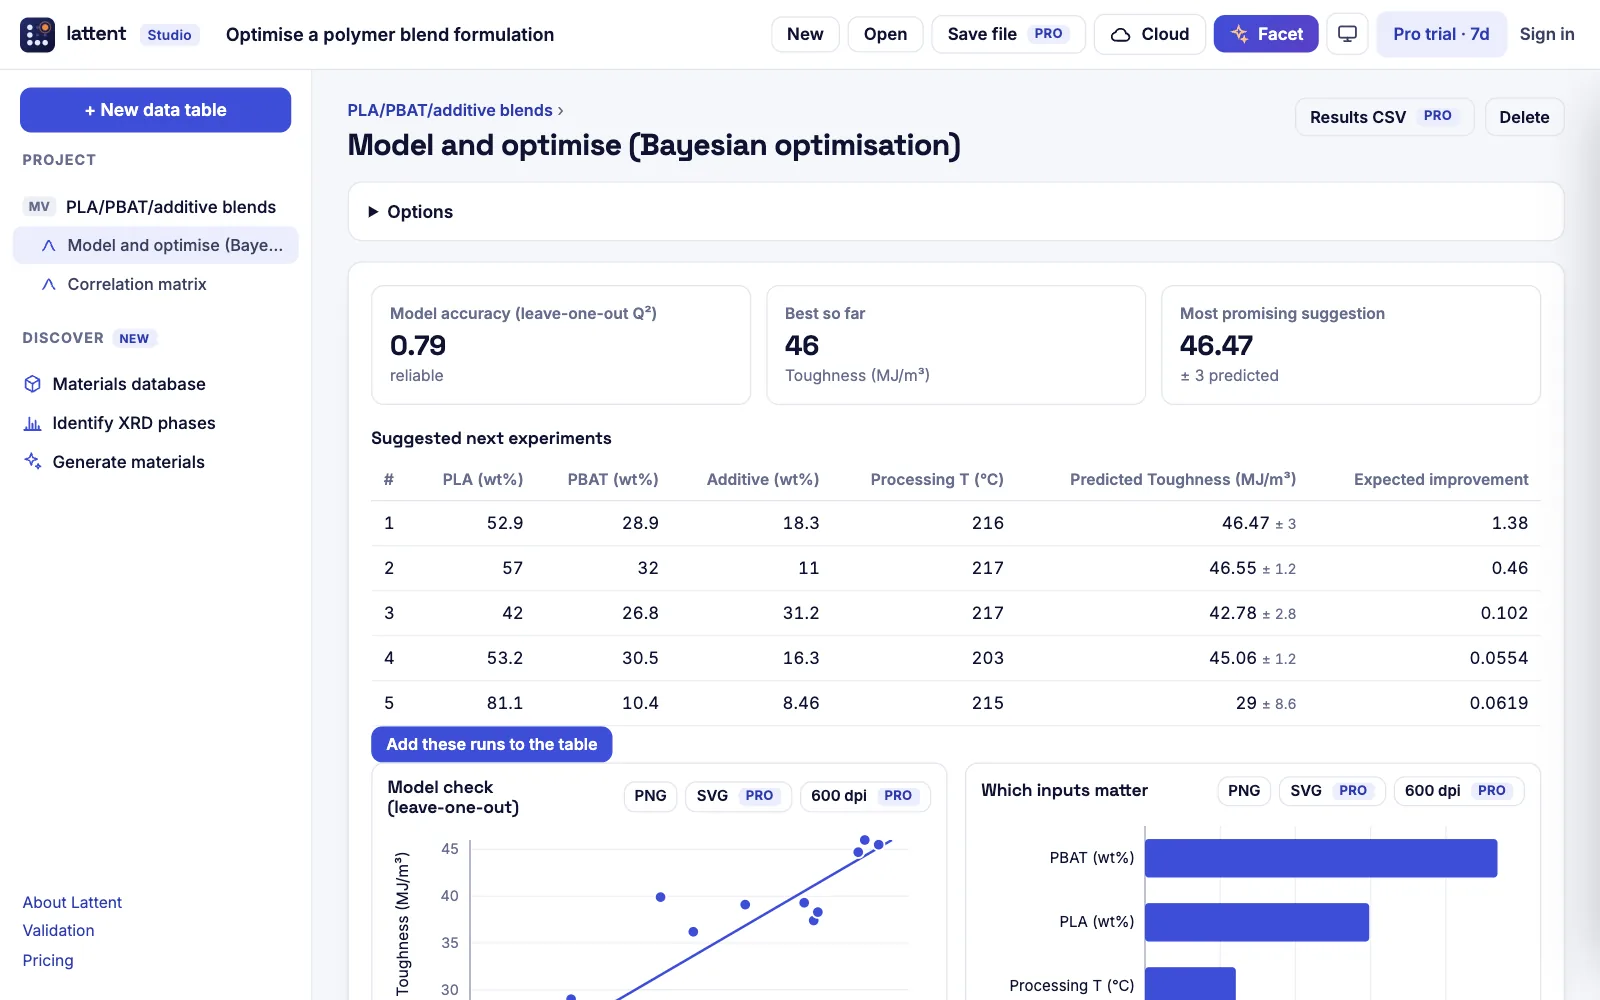
Lattent learns a Gaussian-process model of a property from the experiments you have run, such as the toughness of a polymer blend, the yield of a synthesis or the conductivity of an electrolyte. It shows which inputs matter and proposes the next experiments most likely to improve the result, respecting mixture constraints. Add them to your table, run them, and repeat.

  • Bayesian optimisation with expected improvement, in batches
  • Cross-validated model accuracy, so you know when to trust it
  • PCA, k-means clustering and correlation for exploring datasets
Bayesian optimisation suggesting the next polymer blend experiments

Statistics with the checks built in

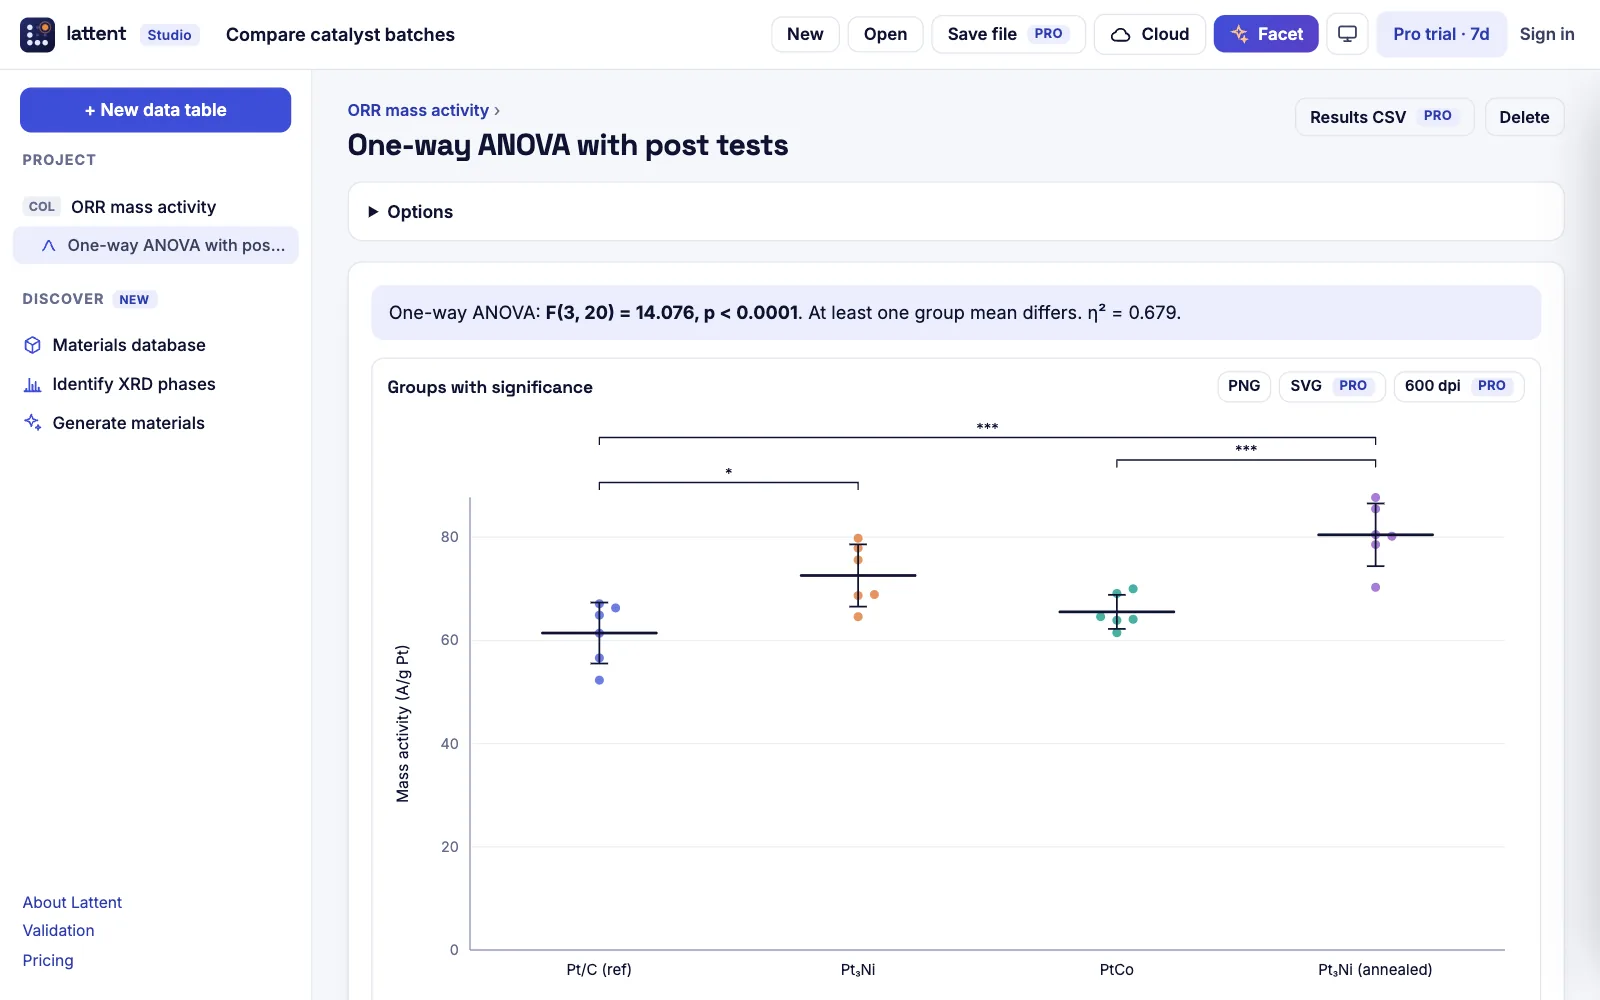
t tests, Mann–Whitney, one-way ANOVA, Welch's ANOVA and Kruskal–Wallis, with Tukey and Holm–Šidák post tests. Lattent checks equal variance and normality for you, suggests the right test when an assumption fails, and draws significance stars on the graph.

  • Descriptive statistics, normality tests, Grubbs outliers
  • Effect sizes and confidence intervals, not only p-values
  • Correlation matrices and multiple linear regression
One-way ANOVA comparing catalyst batches with Tukey significance brackets

An AI lab partner that reads, checks and never makes up a number

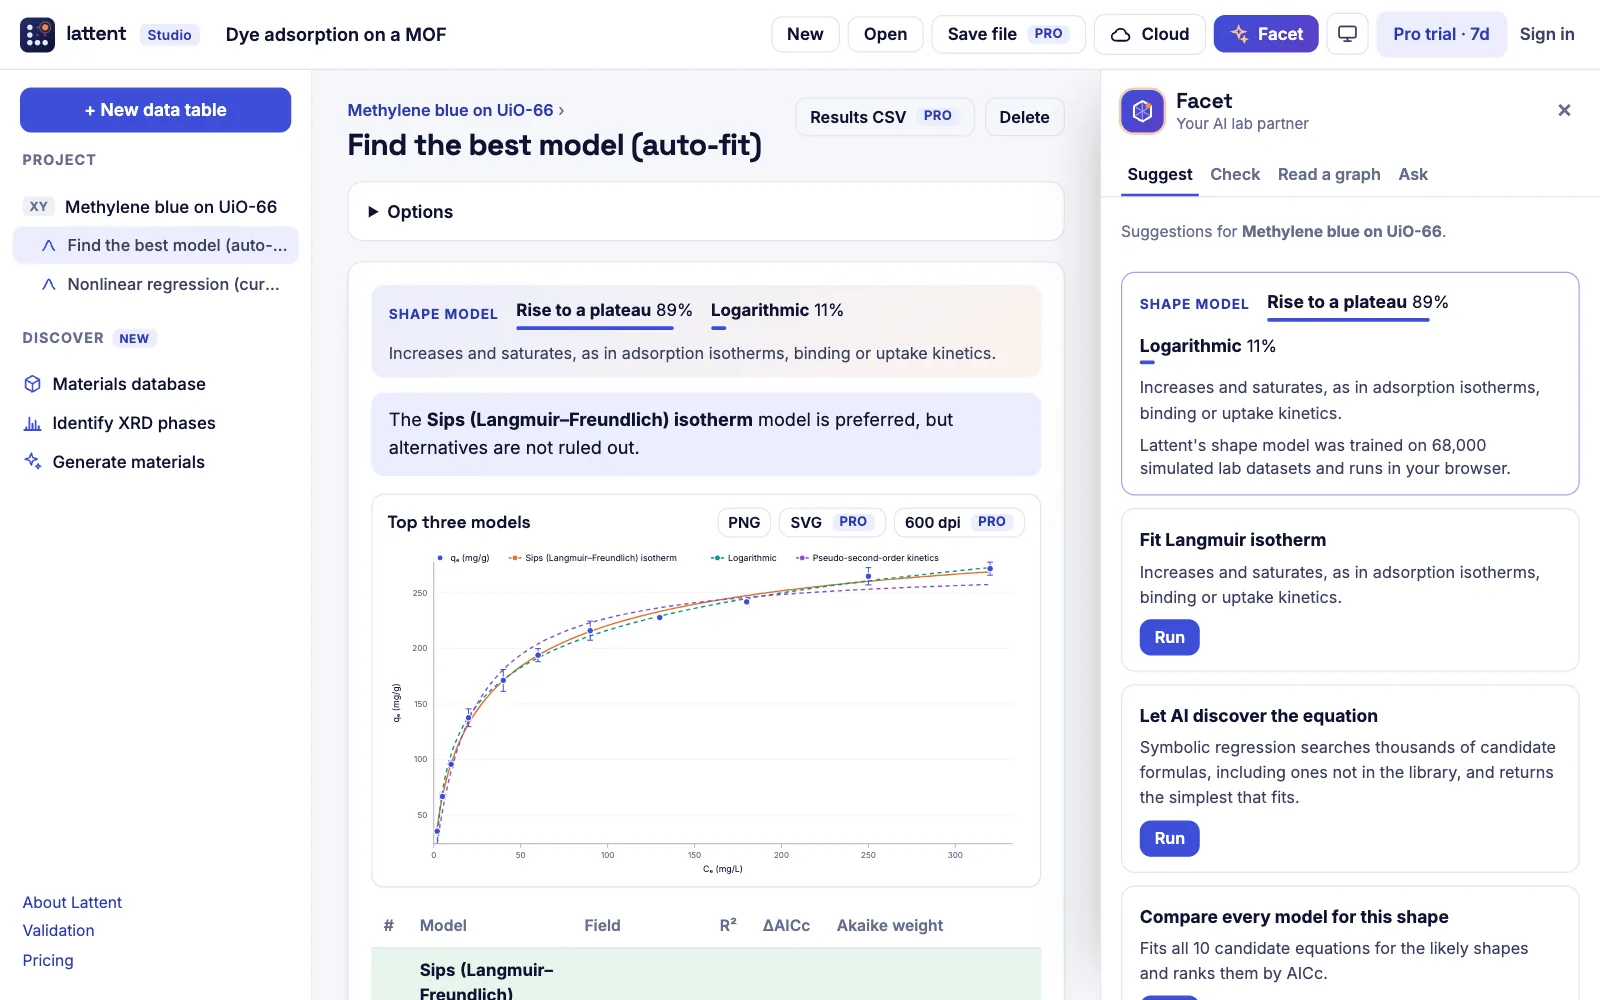
Open Facet, Lattent’s AI lab partner, on any table. Its built-in suggestions come from Lattent's own shape model, a neural network trained on 67,600 simulated lab datasets across 13 families of behaviour. It recognises a spectrum, an absorption edge, a thermally activated trend or a saturating isotherm, and proposes the right analysis with one-click Run. Facet also checks your whole project for errors (missing units, too few points, poorly determined parameters, the wrong test), reads graphs (drop a picture of a plot and it traces the data into a table) and runs as an autonomous report agent: it plans the analyses, runs them, checks them and writes the report. Connect your own Claude or GPT key to ask in plain language or attach a figure to have it interpreted and critiqued; the language model plans and explains, and Lattent's validated engine does the maths.

  • Suggestions, project checks, graph reading and the report agent work offline, with no key
  • Shape model: 98% accurate on held-out data
  • Attach a figure and ask what is wrong with it
  • Chat proposes analyses you approve before they run
The Facet panel showing Lattent's shape model recognising an adsorption isotherm

Data tables shaped for the analysis you need

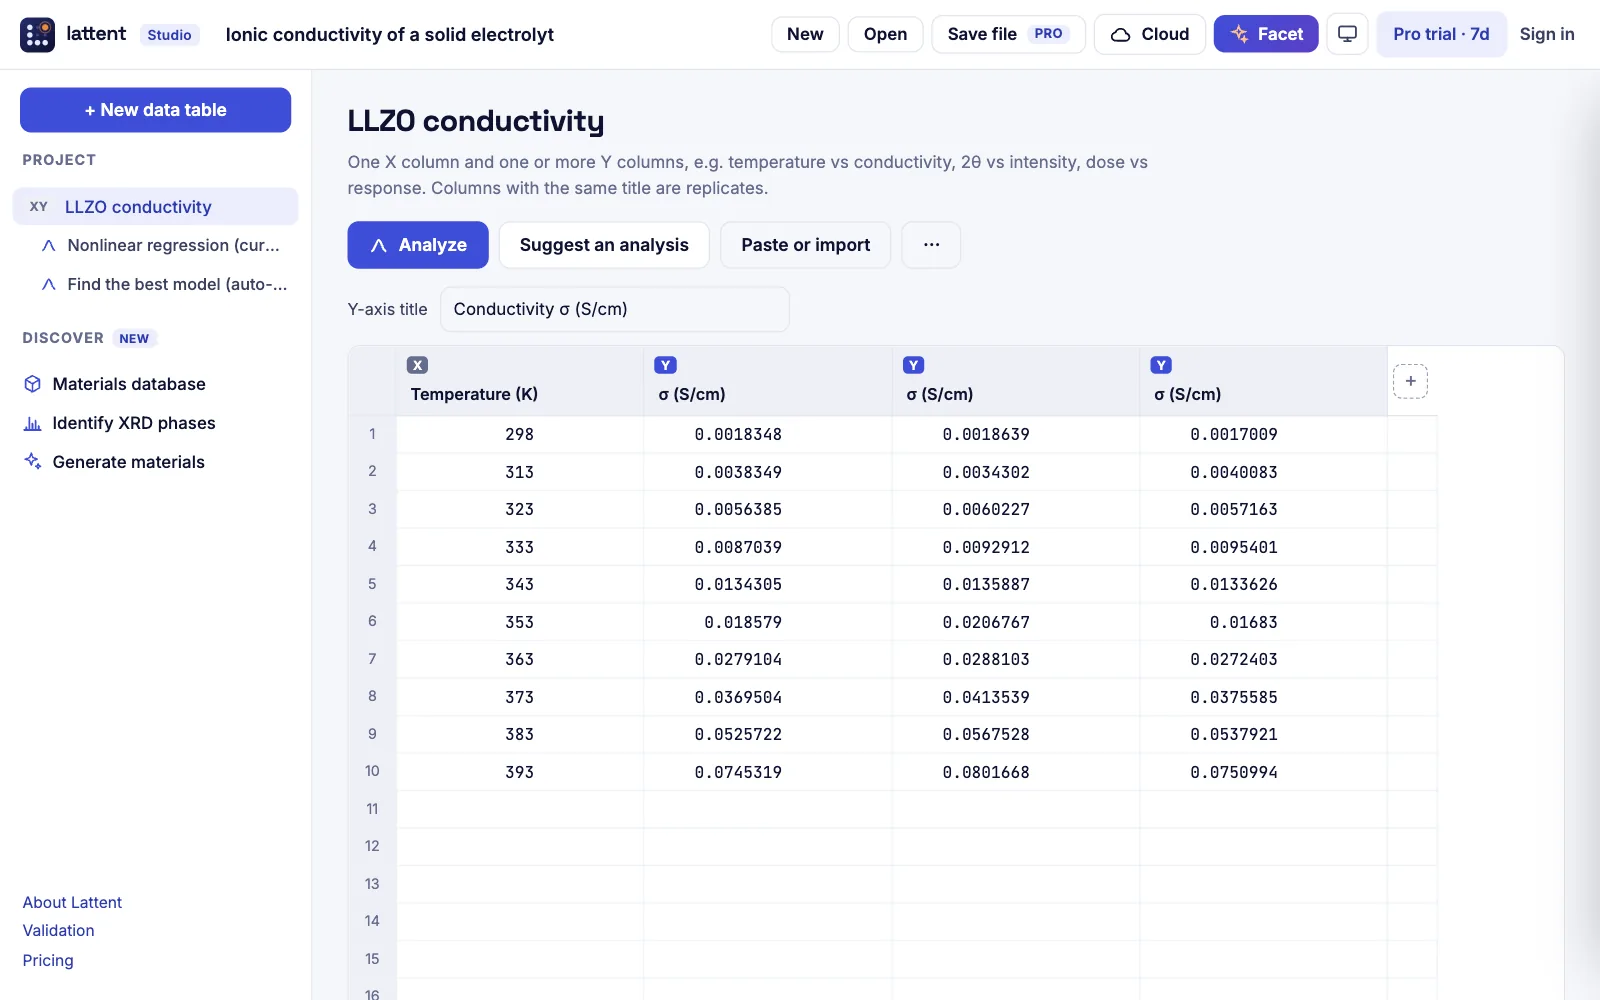
Choose an XY table for curves and spectra, a Column table for comparing groups, or a Multiple-variables table for compositions, process settings and properties. Paste straight from Excel or an instrument export; replicate columns are recognised automatically.

  • Spreadsheet editing with paste, transpose and CSV import
  • Each table remembers its analyses and graphs
  • Projects are saved in your browser and can be exported as a file
An XY data table of ionic conductivity against temperature

Figures and methods, ready for the paper

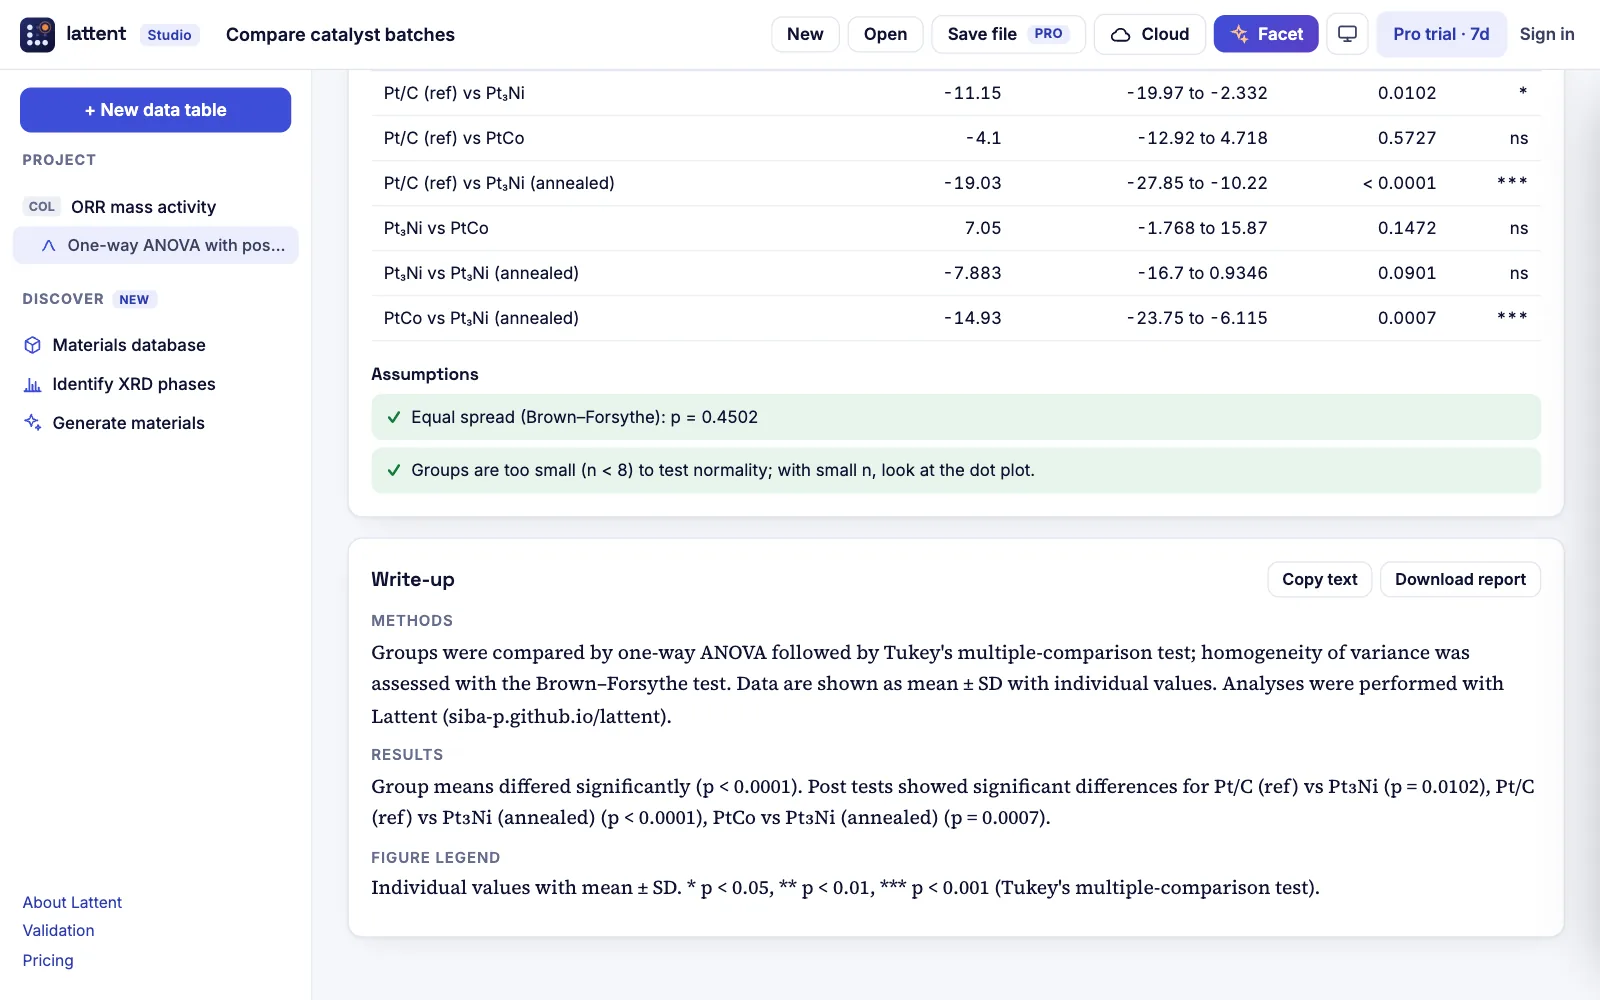
Every analysis produces a figure in a consistent, colour-blind-safe style, exportable as 600-dpi PNG or editable SVG, together with a methods paragraph, a results sentence and a figure legend written from your numbers. Copy them into Word, or download a one-page report for your notebook or supervisor.

  • Methods text names the model, weighting, tests and corrections
  • Results tables as CSV
  • Reports that record exactly what was done
Auto-written methods, results and figure legend under an ANOVA graph

Start from a worked example

Each example opens in Studio with realistic data and the analysis already run. Change the numbers and watch everything update, or replace them with your own.

Everything in Lattent Studio

Curve fitting

  • Nonlinear regression, 35 built-in equations
  • User-defined equations
  • Automatic model selection by AICc
  • Parameter constraints and weighting (1/Y, 1/Y²)
  • Confidence intervals and bands
  • Derived parameters by the delta method
  • Residual plots and runs test
  • Linear regression with slope comparison

Equations by field

  • Materials and chemistry: Arrhenius, Vogel–Fulcher–Tammann, Langmuir, Freundlich, Sips, pseudo-first and second-order kinetics, Avrami (JMAK), stretched exponential, Tafel, Curie–Weiss
  • Polymers: Flory–Fox, Mark–Houwink, WLF, Carreau, Cross
  • Nanomaterials and physics: Hall–Petch, quantum confinement
  • Biology: dose–response, Michaelis–Menten, Hill, binding
  • General: exponentials, power law, sigmoids, peaks, growth curves, polynomials

Spectra and materials

  • Multi-peak fitting (Gaussian, Lorentzian, pseudo-Voigt)
  • Polynomial baseline removal
  • XRD: d-spacing, Scherrer size, Williamson–Hall strain
  • Tauc band gap (direct and indirect)
  • Tensile test: modulus, 0.2% yield, UTS, elongation, toughness
  • Area under the curve
  • Savitzky–Golay smoothing and derivatives

Statistics

  • Descriptive statistics, geometric mean, CV
  • D'Agostino–Pearson normality test
  • Grubbs outlier test
  • Welch's, Student's and paired t tests
  • Mann–Whitney (exact and asymptotic)
  • One-way ANOVA, Welch's ANOVA, Kruskal–Wallis
  • Tukey and Holm–Šidák post tests
  • Brown–Forsythe equal-variance test
  • Pearson and Spearman correlation

Machine learning and discovery

  • Multiple linear regression with standardised effects
  • Principal component analysis
  • k-means clustering with silhouette selection
  • Gaussian-process regression with feature relevance
  • Bayesian optimisation with mixture constraints
  • Leave-one-out model validation

AI and machine learning

  • Shape recogniser for 13 families of behaviour
  • Equation discovery by symbolic regression
  • AutoML: six model types, cross-validated
  • Permutation importance and partial dependence
  • Conformal prediction intervals
  • Composition descriptors for materials data

Discovery and generative AI

  • Live search of 5.8 million DFT structures (Alexandria, OPTIMADE)
  • 3D crystal viewer and conventional cells
  • Simulated powder XRD with Miller indices, any common anode
  • XRD phase identification with lattice refinement and second-phase detection
  • Masked-diffusion generator of new compositions, guided by band gap
  • Formation-energy and band-gap prediction from composition
  • Novelty check against the database, CIF export

Graphs, reports and AI

  • Live graphs that update with the data
  • Log axes, error bars, significance brackets, heatmaps
  • PNG, 600-dpi PNG and SVG export
  • Auto-written methods, results and legends
  • CSV results and HTML reports
  • Facet: suggestions, project checks, graph reading and Claude or GPT chat

Quick tools

One-step analyses for the measurements you make every week. Paste your data; the result opens in Studio with its figure and methods text.

XRD crystallite size

Peak fitting, d-spacing, Scherrer and Williamson–Hall.

Open →

Band gap (Tauc plot)

UV–Vis to optical band gap, direct or indirect, with a confidence interval.

Open →

Activation energy

Arrhenius or VFT fits giving Eₐ in kJ/mol and eV.

Open →

Adsorption isotherms

Langmuir, Freundlich and Sips compared by AICc.

Open →

Tensile test

Modulus, 0.2% yield, strength, elongation, toughness.

Open →

Peak fitting

Raman, FTIR, XPS and chromatography peaks on a fitted baseline.

Open →

Calibration curves

HPLC, ICP, UV–Vis or ELISA calibration with unknowns and LOD/LOQ.

Open →

Curve fitting

Any XY data: shape recognition, 35 equations, AICc ranking.

Open →

Also available: life-science tools for IC50, enzyme kinetics and qPCR.

Early-access pricing

Free for analysis. Pro when you publish.

Every analysis, table and warning is free, without limits. Pro adds what goes into papers and reports, more cloud storage and the AI chat, for less than a coffee a month.

Free

$0

for everyone, forever

  • All analyses in Studio and the calculators
  • Live graphs, tables and warnings
  • Facet suggestions and checks
  • 3 cloud projects with a free account
Open Studio

Pro Best value

$29 / year

or $4 per month

  • 600-dpi PNG and vector SVG, no watermark
  • Auto-written methods, results and legends
  • Unlimited cloud projects, 250 MB
  • Facet chat with your Claude or GPT key
  • CSV results, reports and project files
Get Pro

Lab

$99 / year

up to 10 people, one invoice

  • Everything in Pro for the whole group
  • Shared lab projects that everyone can open and edit
  • Invite and remove members yourself
  • Invoice for grant or department funds
Get Lab

Prices in US dollars; rupee prices are on the pricing page. Secure checkout by Lemon Squeezy worldwide or Razorpay in India; Lattent never sees card details. Pay by card, PayPal or UPI, or by invoice for institutions; compare plans and payment options. Cancel any time from your account. 14-day refund, no questions. How we keep your data safe.

Questions

How is this different from Origin or GraphPad Prism?

Lattent is built around the measurements materials and chemistry labs actually make (XRD, spectra, band gaps, isotherms, Arrhenius data, tensile tests), with curve fitting, statistics and publication graphs underneath, plus a shape model, Bayesian optimisation and Facet, an AI lab partner. It runs in any browser with nothing to install and costs a fraction of a desktop licence. It does not yet do everything those programs do, such as 3D plots or two-way ANOVA; those are on the roadmap.

Is my data uploaded anywhere?

Not unless you choose to. Calculations run in your browser and projects are kept in your browser. If you save a project to the cloud, it is stored in a database where row-level security lets only you, and your lab if you share it, read it. The optional AI chat sends data directly from your browser to the provider you chose, with your own key. Details on the security page.

Is payment secure?

Yes. Checkout is run by Lemon Squeezy, a PCI-compliant merchant of record that also handles tax. Lattent never sees your card. Your plan is activated by a signed message from Lemon Squeezy to our server, never by your browser.

How do I know the numbers are right?

Every analysis is checked against SciPy and NumPy, the reference scientific Python libraries, on test datasets before each release: parameters, standard errors, p-values, Tukey intervals and Gaussian-process predictions. The fitter is also benchmarked on NIST’s certified nonlinear-regression problems, where it gets 51 of 52 fits right to at least four significant digits. See the validation page.

I have never used curve-fitting software. Where do I start?

Open a worked example close to your field, look at what Lattent reports, then replace the numbers with yours. Or create a table, paste your data and press Suggest an analysis.

Do I need an AI subscription?

No. The built-in suggestions need no key. The chat is optional and uses your own Anthropic or OpenAI key, billed by them at their API rates, usually cents per conversation.

Can my lab pay with a purchase order or grant?

Yes. Lemon Squeezy issues a proper invoice with your institution's details; for purchase orders, use the Contact link at the foot of this page.

Does Lattent really generate new materials?

It proposes new chemical compositions that its models predict to be stable and close to a target band gap, and tells you which are absent from a database of 5.8 million computed structures. That is a shortlist for a DFT calculation or a synthesis, not a discovery in itself: the generator works at the level of composition, not crystal structure, and composition-only predictions have errors of about 0.09 eV/atom for formation energy and 0.3 eV for the band gap. The methods and test results are on the validation page.

Is it suitable for regulated or clinical work?

No. Lattent is research software and is not validated for GLP, 21 CFR Part 11 or diagnostic use.
Your next figure is one paste away.

No account, no installation, nothing uploaded.

Open Lattent Studio